
Biodiversity Knowledge Maps
Together with the digitalization of samples of natural history accumulated over the centuries, the technological revolution has brought big data opportunities in the field of biodiversity. To know the distribution of the species is available in a succession of clicks of the most abundant and detailed information in history. However, the amount of information itself can compromise the credibility of biodiversity maps.
From natural history ? i-natural
Edward O. Wilson proposed the term biofilia to claim the congenital vocation of the human being towards living beings. Once food and protection were guaranteed, man began to investigate and classify living beings from a useless perspective [1]. Since then we have been working for centuries to complete and understand the puzzle of biodiversity.
XVII. and XVIII. The 15th century witnessed multiple explorations of nature. In those times also began exhibitions of biological collections. Examples of this are the Museum of Natural History of Paris, founded in 1635, or the Kunstgela, founded about 300 years ago by Petri I of Russia, in which animal collections from all over the world were exhibited [2] (including rare animal forms).
In addition to the abundant discoveries of new species, the XIX left us pioneering works in understanding the distribution of life forms (biogeography) and origin (evolution). centuries. Humboldt, Wallace and Darwin themselves relied on biodiversity observation to materialize their ideas; trying to answer questions about biodiversity, turning biodiversity into a kiss.
XX. In the 20th century, the cataloguing of species and the documentation of their distribution continued. By 2000, museums and herbariums had about 3 billion specimens [3].
Although the legacy of the centuries is impressive, the technological revolution of recent decades has left this barrier small. The development of data repositories and digital tools (apps, GPS, Smartphones) have allowed a massive collection of information, while achieving the “democratization” of biodiversity cataloging. At present, most species distribution data are collected by volunteers to a different extent than the previous one. For example, more than 28,000 people from 170 countries participated in the Global Big Day, with 1.6 million records of 6,899 bird species (2/3 of the known) [4].
Biodiversity maps at a click
Along with the development of new forms of data collection, in recent years there have been important paradigm shifts in data ownership. Millions of data have been opened that were collected in museums and herbariums, without limits and free of charge for the user. All this has facilitated the development of information exchange platforms [5]. Global Biodiversity Information Facility (GBIF) is the world's best-known platform that has put unified and standardized records of species from more than 1 meeting for online consultation.
The usefulness of information creates new opportunities in areas such as economic (e.g. through wildlife tourism), educational, ethnobotanical and, of course, biodiversity conservation. Indeed, biodiversity maps are critical to solving multiple ecological and conservation issues, including: How are species distributed? What role do present and past environmental conditions and geographical and ecological factors play in this distribution pattern? What are the hotspots of biodiversity? How has the distribution of a certain species changed (for example, an invasive, threatened species)? How will it change in the future? Of course, all these responses can be of paramount importance in addressing the consequences of anthropogenic changes [6].
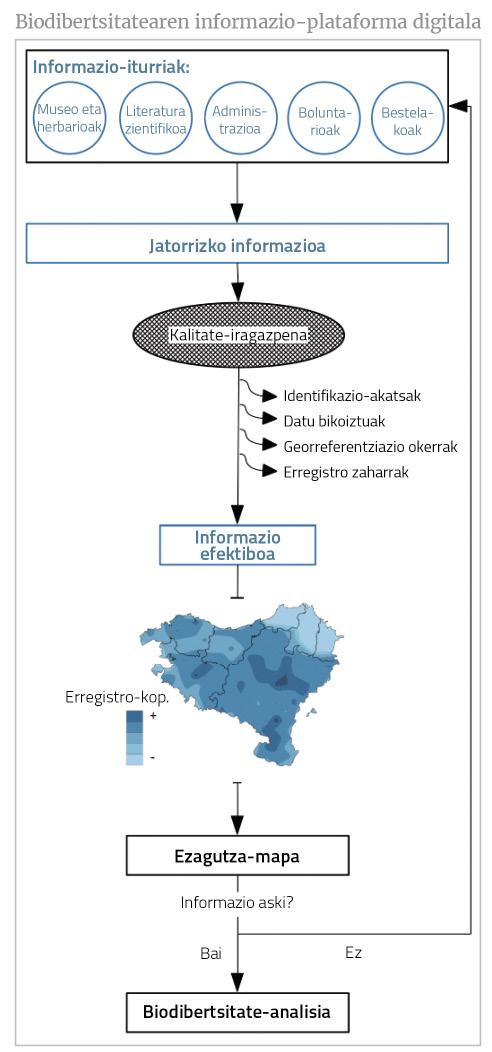
Although we have so far apologized for the information available, the biggest challenge is to guarantee the quality of the information itself. Any input of information, whether collected on the mountain or from an old source of information (including gray literature), must be validated before giving the digitized approval. Most supplying information platforms follow strict detection and cleaning protocols for possible errors (e.g. taxonomic, associated with georeferencing) and there are numerous support tools for post-processing information (for taxonomic homogenization, for cleaning duplicate and misreferential data, etc. ). However, it is usually not a slow job to get the information to have a minimum level of quality and, sometimes, these screening operations can mean the exclusion of much information. Therefore, in addition to quantity, quality will limit the size of effective information (Figure 1).
Big Data achaques, biodiversity trends
Since most specimens and species location records have been received without planning, the distribution of information is not homogeneous between taxonomic groups, neither in space nor time [7]. In addition, the combination of diverse sources of information can increase heterogeneity, to the point of compromising the credibility of biodiversity maps.
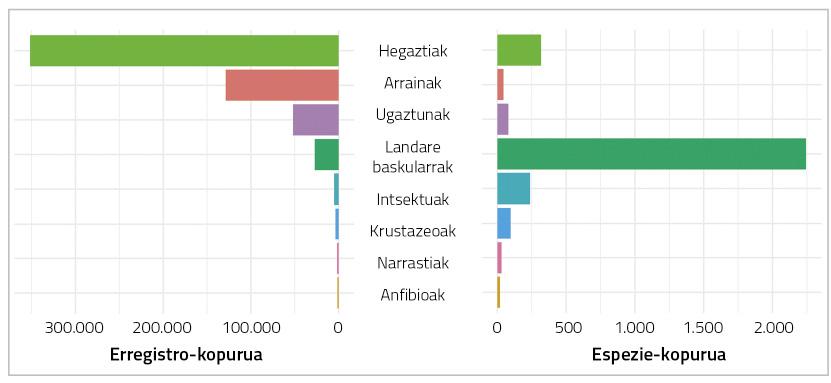
Traditionally, some taxonomic groups have gained more attention than others (Figure 2). Although both experiences can be fascinating, people tend more to observe birds than to make snail collections. Likewise, to the extent that rare, emblematic, threatened species, etc. are treasures most appreciated for nature lovers, are documented more intensely, as reflected in the number of biodiversity platform records.
Also, some geographic areas are better shown than others. Except for exceptions, the hottest information points are natural spaces. Prized species often act as bait, as species attract nature lovers to their places of residence [8]. In other cases, logistical reasons focus on the proximity to the home of the main data recipient, the existence of a public access area, accessibility or the existence of a long-term monitoring zone [9].
Thus, both taxonomic and spatial trends can be variable over time. This allows to know well the past distribution of a species, but not the current one (also the other way around). In the most serious case, information may become obsolete. Therefore, it is advisable to use only registers of a given period of time that are realistically adjusted to the research objective, although it may be a significant loss of information.

The reasons for taxonomic, spatial and temporal trends can be very diverse, depending on the case and the scale. For reasons, it is essential to identify these trends and assess their impact in order to carry out credible biodiversity analyses. And in this sense, analyzing ignorance can be as important as analyzing one's own knowledge.
Credibility of biodiversity maps
Heterogeneous sampling in biodiversity by space is reflected in databases: some spatial units have more records than others. On a global biodiversity map, the effect of this sampling effort will be lower because biodiversity gradients are more marked. However, on a medium or small scale, the distortion of the sampling effort will be much more serious: the hottest points of biodiversity will correspond to the deepest points, while the colds will correspond to the poorly sampled ones (Figure 3). Behind this result are the accumulation curves of species, which take the form of the saturation curves of enzymes: in the first samples corresponding to a geographical unit many new species will be collected; in the following, less and less, until no more species are found in the unit (saturation).
Knowing at what point is the process of species accumulation, the degree of knowledge (or degree of ignorance) of the species list can be estimated. Thus (or other non-parametric methods, see [10]) it is possible to measure whether each geographic unit is well or poorly displayed and, incidentally, determine the credibility of the biodiversity map [11]. From these measurements you can create a knowledge map that helps us judge whether the information is useful to answer the question that concerns us. In some cases, biodiversity analyses may be limited to “well” units shown [12], while in other cases the need for more data will be evident.
To complete the information gaps, it has been proposed to use species distribution models. However, the models are not at all perfect and, in most cases, it does not seem the best alternative to incorporate more uncertainty into a map with a high degree of uncertainty [8]. So what? Digitizing new data (only 1% of the data from herbaria and museums are georeferenced [13] or it is only necessary to go and search for data to the mountain, a crude reality. However, there is good news, knowledge maps can be an effective tool for planning and optimizing new sampling. In fact, the promotion of sampling in little-known places allows maximizing the contributions of new registers to develop reliable biodiversity maps [14].
In the age of big data as important as ensuring access to information is to encourage its critical use. Knowledge measurement can be the starting point for assessing the credibility of biodiversity maps, as well as for designing sampling to complete them. However, non-specialized users (managers, professionals, natural science researchers, etc.) should perform serious programming and modeling exercises to produce such maps. It is therefore time to break that bottleneck and extend the use of knowledge maps to different areas. Tools to visualize the estimation of the sampling level and its spatial distribution (e.g. interactive web applications).
Knowing how many pieces and where we are missing to complete the biodiversity puzzle can be a solid starting point for advancing knowledge, as well as a sincere exercise of rejection of overly ambitious goals.
Bibliography
Zu idazle
Zientzia aldizkaria