
What time will you do tomorrow?
It is no easy task to predict what time you will do there and here without mistakes. Meteorological phenomena associated with the so-called "time" occur in the most turbulent layer of the atmosphere, the troposphere. In this layer the air moves a lot in all directions, it heats up and cools, which causes numerous trailers. The balance in the troposphere is never reached. In addition, the characteristics of the terrain, like the relief, etc., condition the daily time.
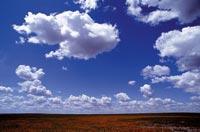
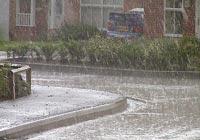
Rain, hail, and snow are closely related to temperature. The average temperature in the troposphere varies depending on the height, usually decreases a degree up about 180 meters. As the temperature cools down, the water vapor in the atmosphere is condensed and clouds form. Although they are of gas, they are not of gas. Once the water vapor is condensed, a few drops of water of 20 microns of diameter are formed, which remain suspended in the air, since they hardly weigh. When the drops reach a diameter between 0.5 and 7 mm the precipitation of the fractions of liquid water occurs, that is, the rain. The drops fall at an approximate speed of 3 m/s. And when that atmospheric water vapor is frozen, it becomes hail. It falls in the form of chubasco and is usually a local and short phenomenon. Normally at the end of the hail comes rain. All these meteorological phenomena take place here and there. But, how are all of them announced?
Weather predictions
Aitor Egurrola, Director of Meteorology and Climatology of the Basque Government, knows how to make predictions. To begin with, “we take atmospheric data from different places in the world.” That is, the pressure is measured at different heights of the atmosphere, direction and strength of the wind, humidity, temperature, etc. And all of them are introduced into a kind of network to obtain local data.
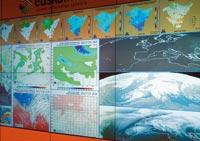
The results are obtained after introducing these data in some meteorological models. From the obtained numerical result, the software represents maps, pressure maps, temperature maps, etc. And with all these data maps, the weather predictor makes the announcement, the interpretation of those maps.
Therefore, even though advertisers have the same results or maps, these may have different interpretations. Therefore, “the final touch is always the advertiser,” according to Aitor Egurrola. “If the maps are bad, no, of course, in that case the model would be bad. On a smaller scale, the greater the error” Models provide new data every six hours, but experts make predictions twice daily.
Air traffic
Rain, hail… and not only they, are many phenomena that meteorologists must predict. And for this purpose they take into account the pressure. Pressure plays an important role in the movement of air, which is responsible for the direction of the air masses. In fact, in the laboratory, for example, the air moves from the high pressure zone to the lower pressure zone, directly, to balance both pressures. On Earth, by the Coriolis effect, that does not happen. The Coriolis effect is a characteristic of the planets (and therefore of the Earth) of rapid rotation, which causes every body that moves on the surface of the Earth to deviate due to the rotation of the Earth. That is why we have meteorology.
The atmosphere behaves as a heat machine, has the heat source in the equator with a clean energy surplus and at the poles a net energy deficit. Therefore, one of the functions of the atmosphere is to transform the potential energy existing between the tropics and the poles into kinetic energy that allows heat transfer.
In the equator the hot air rises and when it reaches the upper limit of the troposphere begins to move towards the poles. In this trip it cools down, so it takes weight and begins to move down to a latitude of about 30 degrees. The air that moves between these latitudes is called the Hadley cell.
If the Earth were not taxing, Hadley’s cells would go ‘straight’ to the poles, but as the Earth moves around an axis that passes through the poles, the Hadley’s cells generated in the equator distort and alter their path through the force of Coriolis. In the northern hemisphere they turn to the right, so the air that goes toward the poles tends toward the east and the return toward the west. By influencing the forces of Coriolis in the Hadley cells, the cells are divided, but the resulting circulations of this division are more frequent through the parallels than through the meridians. Thus, only a tenth of this movement is directed towards the equators or the poles.
In the equatorial zone, the rising air cools down and, therefore, condenses, causing the typical rainfall of the tropical forests. In the areas of low air is heated and the relative humidity decreases, causing drought and "good weather" without precipitation.
However, air traffic is not just that, it is more complex than all that. And to better understand it are isobaric maps. In them the ‘consequences’ of the Coriolis effect are well represented.
Isobaric Maps
The isobaric map is usually the second map of the weather forecast. The atmospheric pressures measured in the weather stations are written and the points of equal pressure are joined by a line. The isobaric lines are, therefore, lines that bind points of equal pressure. It is called bar to the pressure measuring unit from which the name is derived.
These maps are a useful source of information. Depending on the pressure, areas with few or many clouds and wind strength are also defined. Thus, in areas of low pressure, stronger storms are drawn and in those of high pressure anticyclones.
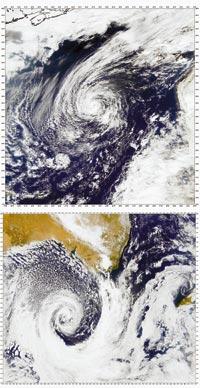
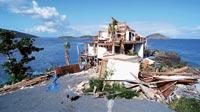
The hurricane is, for example, one of the clearest examples of these low pressure violent disturbances. It extends to many kilometers and produces a wind of 118 km/h. In the Pacific it is called typhoon and around the Indian Ocean it is called cyclone.
They originate in oceans at the height of the equator when the sun heats air masses full of humidity. These air masses rise as they heat up and the air surrounding them begins to plunge sharply in an attempt to fill the gap left by the hot air.
The anticyclones are closed air cores that revolve in the same sense as the clock needles — the opposite occurs in depressions. Inside the anticyclone the air descends, compresses and evaporates the humidity. Therefore, in the area of the anticyclone there are no clouds.
However, movement is not the only cause of clouds. We cannot forget the relief. And it is that, as Aitor Egurrola has told us, at the time of making meteorological predictions, as the scale decreases the data is the same, but another factor is introduced, the relief. Therefore any model is very reliable in the sea, for example, because in the sea there is no relief.
On the contrary, from the coast of Biscay to Alava, the relief is very influential. When the humidity arrives it collides with the mountains. And to ‘climb’ the mountains, that humidity has to cool down, so a condensation occurs, hence the so-called rainfall or orographic precipitation. At sea, however, there are no significant differences from one place to another, so if it is said to be raining somewhere, it usually rains. However, if there is some mountain range on earth, it may rain elsewhere.
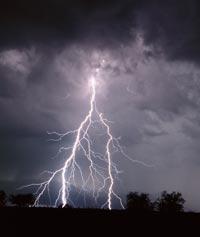
Therefore, taking into account the relief and all the above factors, we know how meteorological phenomena occur. In addition, there are electrical and optical phenomena such as storm or luminosity, lightning, which appears suddenly and strongly together with an electrical discharge that occurs between the two clouds.
Thunder storms are related to convection clouds (cumulonimbos) and usually cause episodes of rain. Then don't say that there is a shortage of energy about us. In fact, the energy released by a thunder attack is equivalent to the electricity consumed in the United States for four days.
Rain, hail, storm… all are local weather phenomena, but they are also global phenomena. Therefore, we cannot deny that logic is an extensive science. Too complex to be exact science. And that same is recognized by experts, who, even indirectly, use some word to express the probability in their predictions. The main reason for this is the complexity of phenomena.
Knowing all this, what time do you think you will do tomorrow?
What are weather models?Meteorological models are nothing more than software with various matrices or mathematical parameters. In the Basque Meteorology Agency, Euskalmet, for example, use the American model of AUBN. It is a free model, from which data are extracted that predict the mesoscale. The models used in this smaller scale are ARPS and MN5, from which they descend to 9 x 9 km. In general, daily predictions are made on this scale. However, in some cases they have been reduced to levels of 3 x 3 km or 1 x 1 km. This last always in a very experimental way. Therefore, it is part of a high level and, by extrapolation, data of lower levels are obtained. The initial point is in the outputs or numerical data of the CSM. These data are of a scale of 90 x 90 km and, introducing these outputs or numerical data in other models, it is reached to minor scales. |
A little history
Although since 1626 we use the term meteorology as science XIX. It began to work in the early twentieth century. In fact, adequate meteorological data requires, among other things, exact measurements of temperature, and the invention of the thermometer was a greater job than expected at that time.
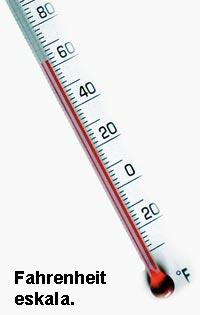
Fahrenheit was the first to solve the problem. However, although the reason is not known, it calibrated the thermometer in a strange way. Established the freezing point of water at 32 degrees and the boiling point at 212 degrees. At approximately 20 years, the Swedish astronomer Anders Celsius presented a new scale. Set the freezing point to 0 degrees and the boiling point to 100 degrees. But the father of modern meteorology is the English pharmacist Luke Howard. He called the clouds: a layer of clouds in general grey, stratum of isolated and compact clouds, clusters and high, thin and light clouds. Later, he added a fourth term, nimbus, for the rain clouds.
The day of meteorology is celebrated every year on March 23, when the International Meteorological Organization was created. It was not born as a government organization, but after a long career, in 1950, it became an intergovernmental organization. It was then called WMO (World Meteorological Organization).
Pocket time pocket time
From now on, to know the time that will happen, just put your hand in your pocket. The meteorological agency of the Basque Government Euskalmet has launched a meteorological information service through the mobile phone.

To know the time on the mobile you have to send an SMS to Euskalmet at 5982 and in 3 or 4 seconds you receive an answer on the mobile.
The information received in the pocket phone is brief and accurate. The information is divided into three parts: high skies, direction and wind strength and maximum and minimum temperature. In addition, a two-day ad is included in a single message.
The weather information message has the same value as any other SMS message.
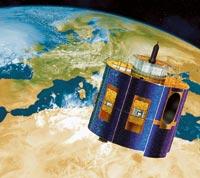
Meteosat. What do we know?
Meteosat satellites receive from space images of the Earth that are used to make weather predictions. We already know that. Many people will have realized, in addition, that they are always on the same place. For the realization of this work are located in the geostationary orbit, at the height of the terrestrial equator. The geostationary orbit is located 36.000 km from Earth.
The Earth turns around and the satellites go with it. At the same speed. That means they always see the same place.
But few know that there are currently four Meteosat in operation and that over time have changed. Three see part of Europe and Africa and a quarter of the Indian Ocean. He was sent to the first Meteosat space in 1977, when there were already many satellites spinning around the Earth. Since then the area has been filled with satellites. Meteosat, for example, has placed in space eight satellites with this name.
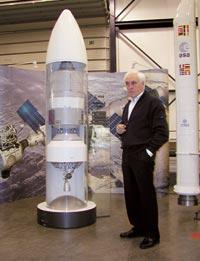
In principle a novena is expected to be launched in August. Elorriotarra Jose Mari Azcarate is a member of the working team that designs and controls the Meteosat satellite.
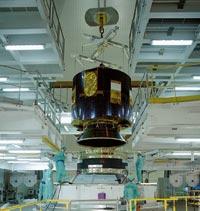
He works in the ESA and in the European Space Agency, among other things, the characteristics of satellites are defined. At present there are approximately 15 people in team. José Mari Azcarate, in particular, works in the area of Quality Guarantee and, with the help of engineers of the rest of subdivisions, verify that both manufacturing processes and trials meet all requirements.
They almost have ready a tenth satellite Meteosat. Once finished the last retouching and testing, they will be stored and left ready to be released in 2009. At the same time, the eleventh edition is being held and they hope to have it saved for 2007. If everything goes well, they will have until 2015-2018. Each satellite has an approximate duration of 7 years.
It is not possible to stay behind, since all these forecasts must be fulfilled.
Zu idazle
Zientzia aldizkaria