
The Atmosphere of Venus (II)
The proximity to the Earth of Venus has allowed us to study the planet quite deeply by building spaces. The missions Mariner 10, Pionner Venus and Venera 11 and 12 sent us very interesting information about this amazing world. Days 9 and 10 of Venera also landed. Until they were destroyed by the atmospheric corrosion of Venus, we were sent a picture of the surface and other information. All these data and those obtained from Earth through radar are the basis of the image of Venus we gave in the previous number. This general image, however, creates important questions that it leaves unanswered. Some are related to time on Venus.
For example, are there storms on Venus? Others are related to the distribution of water vapor. For example, why is not the water vapor distribution constant from the surface to the bottom of the clouds? Has there ever been liquid water on Venus? Finally, we have a phenomenon of striking super rotation. As is known, the turn of Venus is retrograde and has a period of 243 days, but the movement of the atmosphere is not synchronous with the solid part of the planet. The strong winds that constantly blow from east to west (in the sense of rotation of the planet) cause the rotation in the upper part of the atmosphere to occur in a much shorter time.
These winds start about 10 km from the surface and reach 100 km or even higher heights. Its strength increases in height, at least to the limit of the cloud layer. 30 km high the speed is 100 km/h and 100 km high is 360 km/h. The layers that move with this last speed only need 4 days to complete the turn. That is why it is called supergiro.
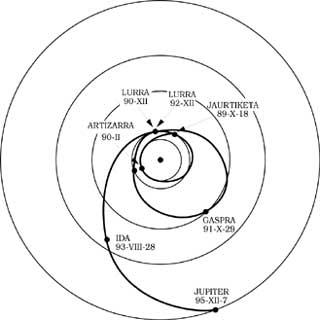
After the first analysis of the data sent by the Galileo Espigón, some clarifications have been obtained on the problems mentioned. The Galileo mission, actually designed to study Jupiter, has moved there around Aritzarra, taking advantage of the influence of its gravity field to increase speed. It has passed with the same objective and will happen again in December 1992 around the Earth. In the first image you can see the details of the Galileo march.
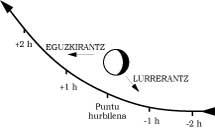
The second is the flight he made around Venus. As you can see, he first studied the night zone and then the daytime zone. The minimum distance to the planet was about 16,000 km. This maximum approach was made on February 10, 1990, when the data obtained were not transmitted to Earth until the third week of November of the same year. The delay was due only to technical reasons. While the space is inside the Solar System, the winning antenna will rise and turn off so that the heat of the Sun will not deteriorate. Without it, however, data could not be sent from Venus to Earth. Therefore, the data were recorded and transmitted by low-gain antenna when Galileo first approached Earth.
Data collection was carried out through two tools. The photographs, made with Solid State Imager or SSI camera, offer short duration details and a resolution higher than that obtained in previous missions. SSI also works in ultraviolet. On the other hand, it is the Near Infrared Mapper Spectrometer (NIMS). This records infrared waves from the vicinity of visible red to the heat radiation zone.
The SSI took photos from the top of the cloud layer (60 km high or). In addition to confirming the winds that provoke the aforementioned overturn, it detected a great activity on a small scale, especially in the equatorial area and in the region where the afternoon or the sunset was the afternoon. This activity materialized mainly in convective cells that developed upwards. These cells appear to be structures similar to storms occurring on Earth and clouds called clusters. Another objective of SSI was the detection of ailments, but in the first data analysis have not been found. However, this result is not very significant considering that the observations were only a few hours.
For its part, NIMS has sent us information on the environment of the cloud layer, since the upper layers are translucent. The instrument gave its best performance when it was dedicated to the dark part of the planet and has built a map of hot and cold points of great wealth. Scientists are surprised that in such a homogeneous inspection plan they did not expect so much wealth.
The hottest spots represent the thinnest regions of the cloud layer so robust. Nims has also found structures similar to storm clouds discovered by SSI. These cells, formed in the equator and displaced to latitudes of 45º north and south, are transformed into long and listed clouds by the strong east-west wind.
It was also expected that the distance from the surface to the starting height of the cloud layer (approximately 30 km) could be studied with nims, but it has not been achieved.
These are the most outstanding conclusions of the first data reading. The study goes ahead and astronomers now want to join the data from the visible and ultraviolet field of the SSI with those from the NIMS to get a three-dimensional view of the atmosphere of Venus and thus solve the problem of the supertwist.
EPHEMERIS SUN: on April 19 enters Taurus, 19 h 56 min. New full moonnow 35 h 1 min 1010h 6 min 174 h 42 min 2421 h 40 minPLANETS
|
Zu idazle
Zientzia aldizkaria