2007/11/01
236. zenbakia

eu es fr en cat gl
Aparecerá un contenido traducido automáticamente. ¿Deseas continuar?
Un contenu traduit automatiquement apparaîtra. Voulez-vous continuer?
An automatically translated content item will be displayed. Do you want to continue?
Apareixerà un contingut traduït automàticament. Vols continuar?
Aparecerá un contido traducido automaticamente. ¿Desexas continuar?
Observing the oceans for signs of climate change
Text created by automatic translator Elia and has not been subsequently revised by translators.
Elia Elhuyar
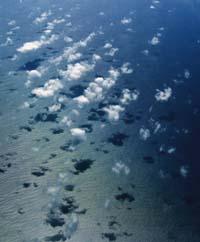
Oceans cover more than 70% of the Earth. And as a fundamental part of the climate system they interact with the atmosphere and the earth. In the climate system, the oceans have enormous heat storage capacity: compared to air, sea water absorbs four times more energy per kilogram by heating one degree centigrade. Thus, in the three surface meters of the oceans there is as much heat energy as in the entire atmosphere. Therefore, the oceans are a fundamental way of heat transport.
Observing the oceans for signs of climate change
01/11/2007 | Fischer, Albert | UNESCO--IOC Program Expert and Oceanographic Researcher/a.fischer@unesco.org
It is not long before the observations of the subsurface ocean began to take place seriously: They began after World War II and concentrated in areas with heavy maritime traffic such as the North Atlantic. However, this story is long enough to calculate the trends of subsurface temperatures with a reasonable degree of scientific certainty.
In fact, the subsurface ocean is the ideal place to seek clear evidence of man-made climate change. In fact, a change in the climate system, such as the one caused by greenhouse gases, forces the entire climate system to find a new balance: As the earth is warmer, it emits more heat to the space to compensate. This extra heat is mainly absorbed by the oceans. On the other hand, the subsurface oceans are less noisy than the superficial ones -- which are influenced by time and time seasons -- so they are the clearest signs of long-term climate change.
An indisputable proof of the oceans
In an article published in the journal Science in July 2005, Tim Barnett and his colleagues demonstrated that the warming trend observed in the oceans over the past 40 years cannot be explained through natural variability, but that this trend was clearly associated with climate predictions that take into account man's influence on climate. However, this discovery did not correspond to measurements made elsewhere.
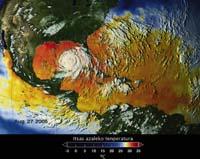
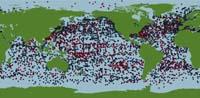
Warm ocean waters cause hurricanes, whose waters were much warmer than normal in the Atlantic Tropics in 2005. Here you can see Hurricane Katrina (August 27, 2005), superimposing a satellite cloud image on a map that provides the sea surface temperature.
(Photo: Recent searches
In any case, the study has provided reliability to models regarding the climate change simulation capacity of climate models including land, ocean and atmosphere. To a large extent, it is no longer questioned that human activity has caused climate change. However, it remains to clarify exactly how it will change.
The World Climate Research Program (WCRP) tries to answer these questions. This program is sponsored by the Intergovernmental Oceanography Commission (IOC) of UNESCO, the World Meteorological Organization (WMO) and the International Council of Science (ICSU). Its main objective is to determine the limits of the predictability of the climate system and of the human influence on the climate.
It is still difficult for scientists to distinguish between man-made climate change and natural climate variability. Climate variability itself seems to be changing: The extremes of incidents outside the "normal" time field are further separated from each other. It is an indicator of climate change. In this context, the WCRP's climate variability and predictability project helps to better predict extreme weather situations and model -- on a temporary scale of better days, months and years.
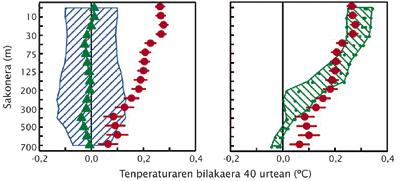
The table on the left shows the mean (green triangles) and the interval (blue shadow) of the models representing the intrinsic variability of the climate. It shows centuries-old data regardless of human influence. The table on the right shows the variability of a climate model (green shade and dots) from the history of human-induced greenhouse gases. The red dots of each table are the ocean tights in the North Atlantic over the past 40 years. The surface waters are the most heated, around 0.25 °C. The table on the right is better adapted to observations than to that on the left, demonstrating human influence on climate.
(Photo: *Image: AAAS. Published with permission from Barnett and colleagues, Science 309: 284-287 (2005)
Observing the oceans to understand them
The UNESCO Intergovernmental Oceanography Commission (IOC) and its cutting-edge programme, GOOS, are responsible for the continued observation of the oceans within the United Nations. A team of IOC experts (OOPC) collaborates in defining the standards and objectives of the GOOS “global climate” concept and in defining system control and evaluation tools.
In parallel, with the participation of the World Meteorological Organization in a technical committee of oceanography and marine meteorology (JCOMM), IOC is actively working on the coordination of global networks through an on-site platform management center (waters) located in Toulouse (France) (JCOMMOPS). This center permanently controls thousands of beacons, boats and buoys, both fixed and drifting, providing oceanographic data.
Among these networks in situ, Argo's network of buoys is the fastest growing. Argo buoys are a robotic and automatic tool to measure the ocean that is applied to 2 km deep in the ocean. Every ten days, pumping oil to an outer tank, they rise to the surface. At the ascension, they collect information about temperature and salinity (some also measure oxygen) and, when on the surface, transmit that information via satellite.
At the end of 2005, over a four-year period, the Argo project had more than 2,000 scattered buoys, two-thirds of the initial target (3,000 buoys), almost a 100,000 km 2 buoy, with a four-year survival. When batteries run out at age four, buoys cannot rise to the surface and many sink.) The Argo buoys have been dispersed across the world's oceans thanks to the efforts of more than 20 participating countries. And in some places, the buoys provide more information about the subsurface ocean for a year than in the entire history prior to Argo's setting.
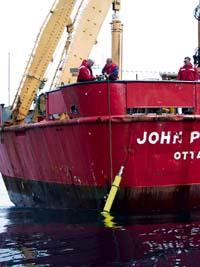
John P. Canada launches an Argo prospect. From the coastal ship Tully to the Gulf of Alaska.
Canada DFO-MPO
On the other hand, the buoys that are adrift on the surface give way to the currents of the world surface, providing data on the surface: temperature, fast and often barometric pressure. These buoys provide real data to check satellite calculations on sea surface temperature, being the best witnesses of ocean surface currents, which are guided by wind and ocean eddies. They also improve weather forecasts by reporting surface pressure.
The objective of the OOPC (expert group of the UNESCO Intergovernmental Oceanography Commission) was to have a buoy of 300,000 km 2, representing a total of 1,250 drifting buoys. Objective met in September 2005: 1.250. The Global Drifter buoy was launched at a special event in Halifax, Canada. He was the first of the networks established for on-site observation of the ocean that fulfilled its goal, a truly memorable fact.
However, scientists cannot proclaim victory and simply go home. The network of drifting buoys must be continuously renewed, as buoys fail and quickly move away from areas of divergence. In addition, only 55% of the planning of the global in situ ocean observation network (composed of buoys, receivers, prospectors, seafarers and voluntary and research ships) has been completed.
Scientists walking the oceans
In addition to the buoys, ships also participate in research. The merchant ship Skogafoss, container cargo of 100 meters in length, sets sail monthly from the port of Reykjavik (Iceland). Transports frozen fish containers to North America. Back at two weeks, he makes the same trip, year and year. In the North Atlantic it takes the northernmost boat route and, despite being in the middle of spring, it must avoid the icebergs that the Labrador Current leads to the south.
Seeking global coverage: in situ ocean observation platforms in October 2005. They provide real-time data. This data is obtained mainly from: Argo beacons (dark blue), occasional boats (light grey, light blue and yellow), fixed buoys and drifting buoys (red). The oceans that cover with ice during some seasons continue to generate technical problems.
(Photo: JCOMMPS)
Skogafoss is also a voluntary observation vessel. It emits radio waves (atmospheric prospectors) periodically from an automatic laboratory mounted on the rear bridge. It has automatic systems for capturing surface weather and sea surface temperatures, as well as instruments for measuring atmospheric and oceanic carbon. Every several hours, the officer in charge goes out on a bridge slope, loads a beater scanner (XBT) and fires. The XBT drops into the ocean and measures a temperature profile. It provides data through a detached copper wire, thinner than human hair. These observations form a fundamental part of the global system and are coordinated through JCOMM observation vessel groups. The captain and the company of the ship provide their services for free, voluntarily providing their time and space on board.
This is a gift for scientists, as modern research packages are often very expensive. Fuel, maintenance and equipment of 3-8 people (official media team, engineers and sailors) pay between 20,000 and 50,000 dollars a day. These voluntary packages are, in turn, one of the main engines of expansion of the drifting surface buoys and Argo buoys, which fill the gaps of the observation network as they appear.
Global information for local decisions
The global component of GOOS was designed to monitor, predict and investigate climate, but it also contributes to improving weather and marine prediction. It manages and disseminates ocean data (currently supplied by about 70 countries) in a coordinated manner, from which they create oceanic and climatic models and other products. For example, IOC plays an important role in coordinating global natural hazard alerts, especially regarding tsunamis. In fact, many times the observation platforms that feed the warning systems are the same: associated buoys and marographs are used, both in climate observation systems and in tsunami observation systems.
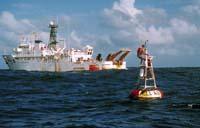
One of the 70 fixed buoys of the tropical Pacific. He controls the events of El Niño and makes his predictions within the global system of ocean observation. For the last time, the phenomenon El Niño occurred in the period 2002-2003.
NOAA
However, the commitment of States is not sufficient. The oceans of the world that cover so much of the Earth are the heritage of all nations. Almost all countries, rich and poor, have a national meteorological agency that makes atmospheric predictions, but very few have an oceanographic agency for observing the oceans and even less an order of observation of the world's oceans.
Ocean observation networks were built thanks to the constant work of oceanographic researchers. However, the existence of the network itself poses problems, as is the case with the instruments of measurement of subsurface currents that have been controlling thermohaline circulation in the Atlantic for more than ten years, but some of them will not be renewed, since national research agencies prefer to create something new. Once this surveillance is over, there will be nothing else to supply that absence.
Poor long-term forecast

Training course in data management at the Office of Data Sharing and International Oceanographic Information (IODE) of IOC (Oostende, Belgium). In these courses, countries have a greater ability to participate in ocean observation systems and teach them how to benefit from these systems.
(Photo: UNESCO/IOC)
World governments do not commit to permanent observation because they have a short-term vision. Politicians are very weak at the human-caused greenhouse gas problem, but it is clear that the climate continues to change and that this change can accelerate.
Scientific observation and research are critical to help understand how climate will change, improve predictions about short-term changes in local climates, improve our limited knowledge of ocean chemistry and how to change ecosystems, and provide better knowledge to global governments and citizens to make future decisions.
Earth's climate has been altered unprecedented by man. Addressing the conclusions will require collecting as much information as possible.
For more information:
http://ioc.unesco.org/iocweb/climate-change
Source: UNESCO. "Watching the oceans for signs of climate change", A World of Science, 4. vol. No. 1, January-March 2006 (http://www.unesco.org/science/)
Article translated and adapted by Elhuyar with the authorization of UNESCO.
Ocean Conveyor Belt
The average temperatures of the equator and poles are different due to the Earth's inclination towards the Sun. However, this difference is much smaller than one might think. In fact, the oceans and atmosphere transport heat to the poles and ensure a more pleasant balance (at least for humans), cooling the temperatures of Ecuador and heating the poles.
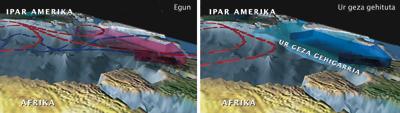
On the left: The warm waters of the North Atlantic surface are headed north (red lines) representing the flow of deep cold waters to the south (blue lines). Thus, the heat is transported to the north and the winds that go towards Europe, towards the east, are heated (large red arrow). If melting ice added a large amount of fresh water to the system (on the right), sea water would not sink into the North Atlantic. It is possible, therefore, to parallel the transport of heat to the north of the ocean, with which the supra-European winds would be much colder despite global warming (large blue arrow).
(Photo: J. Cook/WHOI)
The oceans carry half of the heat through the surface and deep currents, through a system known as the "conveyor belt" of the oceans (thermohaline circulation, see figure below). The Gulf Stream is one of the most used ocean routes and by the east it warms Europe. This surface current carries tens of millions of cubic meters of hot tropical water every second. And since mid-latitude weather systems generally move from west to east, thanks to the Gulf Stream, Naples is warmer than New York, although both are located at the same distance from Ecuador.
On the other hand, the evaporation of water into the atmosphere leaves behind a more salty and cold water, and therefore denser. Consequently, the subsurface waters are the densest, coldest and salty in any part of the world and are formed mainly in the polar North Atlantic, due to extreme winter evaporation and heat loss; most of the subsurface ocean is located a few degrees from freezing.
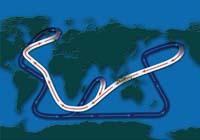
Journey through the ocean conveyor belt.
(Photo: J. Doucette/WHOI)
These deep, cold, salty and dense waters, originating in the North Atlantic, are transported by deep flows that go from origin to south and, with hundreds of years, after their expansion to other oceans, the wind and tides return to the surface. There they heat the suns and thwart the rains. They finally return to the poles from the surface of the ocean and repeat the cycle.
Well, most climatic models that take into account the change caused by humans show that the ocean conveyor belt will slow down as the weather warms.
Is climate change possible?
Past studies of fossils and ice samples show that the climate system suffered abrupt leaps in the past.
The last violent climate change took place at the end of the last ice age, about 12,000 years ago (at that time man began to settle in America and elsewhere was engaged in agriculture). Melting ice sheets in North America abruptly released a large amount of fresh water to the North Atlantic. Fresh water is less dense than salt water, and by increasing both fresh water, deep water ceased to form as is customary in the polar North Atlantic. (see section Ocean conveyor belt). As a result, thermohaline circulation stagnated and in less than a decade average temperatures dropped around 5º C in the North Atlantic.
Several scientists fear that thawing the Greenland ice sheet will cool the North Atlantic and cause a drastic change. A film about a disaster was recently shot in Hollywood, taking this situation to the extreme. But what is the threshold of abrupt and terrible climate change? Current climate models do not have enough rigor to say so. However, the consequences of abrupt climate change could cause a catastrophe in ecosystems and society.
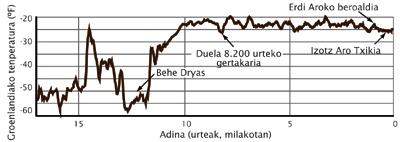
Ice samples taken from the 3 km thick Greenland ice sheet indicate sharp climatic changes in just ten years. Lower Dryas was the most spectacular period: Average temperatures in the North Atlantic declined sharply and continued in 1,300 years. Subsequently quickly reheated 2.
(Photo: Recent searches
There are already indications that the conveyor belt is tilting. Scientists have announced that deep cold rapids moving south in the North Atlantic decreased by about 30% between 1957 and 2004 1 --5 expeditions have measured in five decades. Should we consider this descent as a cycle of natural variability or a long-term change in the ocean conveyor belt? Only time -- and continuous observations -- will clarify it.
1. These findings were published by Harry Bryden and his colleagues in issue 1 December 2005 of the journal Nature.
2. All images of Woods Hole Oceanographic Institution Abrupt climate change: should we be worried? have been taken from the booklet with the consent of the authors. Prepared for the Economic Forum of Davos (Switzerland, 2003): www.whoi.edu/institutes/occi/currenttopics/ct_abruptclimate.htm
The Child, seen from the buoys
(Photo: Recent searches
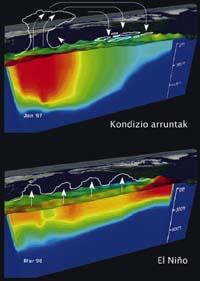
Temperature cut in the Pacific Ocean, which in Ecuador goes from east to west, facing north, as seen from the fixed buoys of the tropical Pacific. In general, the air rises above a concentration of hot waters west of the Pacific (upper figure) attracting the surface winds of the east. These winds keep the concentration warm by accumulating hot water. In an outbreak of El Niño (image below), something has weakened the surface winds, allowing hot water to move eastward. The centers of the rising air masses move eastward, further weaken the surface wind and allow the hot water to sink. Positive feedback. Conclusion: a change from the tropical Pacific Ocean and global changes in atmospheric circulation.
Fischer, Albert
Services
236
2007
Results
037
Oceanography
Article
Services