

GIS as an urban work tool
Existing geographic information systems
The most widely used geographic information system so far has been cartography. Paper maps have been drawn, drawn and published through cartography. In short, the maps represent data related to the geographical position. Since for a few years the files are managed by computer, it seems appropriate to also computerize the data in this field. In this way, you can manage all types of geographic information that has been indicated in the maps, in which file they have been saved.
Paper maps cannot display all the information you want, as as data increases the reading becomes complicated. On the other hand, it is very difficult that the paper map includes information such as the age distribution of the inhabitants of a neighborhood. GIS systems do not have these easements because they are not necessarily associated with two-dimensional material support.
Technology integration
Technology integration is very important in GIS. It has united and unified the different technologies. In this way, they integrate traditional forms of geographic analysis, such as overlapping transparent maps to jointly display data of different types, as well as studies and modelling impossible through manual methods. With these systems it is possible to jointly manage maps, modelling and large datasets from the database query. The flexibility offered by this integration is useful in many areas.
For example, they are widely used to detect areas that may be threatened by flooding, or to define ways to follow by emergency relief vehicles. There are many
areas that have contributed to the development of GIS: geography, cartography, photogrammetry, remote sensing, geodesy, engineering, statistics, computer science, artificial intelligence, demography and humanities, natural sciences, etc.
GIS is associated with applications from other databases, but with one important difference: All information available in GIS technologies is related to a spatial reference. Other databases may contain location information (addresses, postal codes, quotas, etc. ). ), but the GIS database uses geographical references as a basic means of storage and access to information.
Using GIS should be seen as a process and not just as software or hardware. GIS is a decision-making tool. The decisive role that can play being seen as a simple software or hardware in decision-making would be not to consider it.
Causes of GIS deployment
Many entities currently invest large amounts in the development of georeferenced databases and GIS, and billions more are expected to be invested in the coming years. All this is happening in a short time. And it is that until a few years ago, the GIS were within reach of very few organizations and only were curiosities for the people. This deployment may have two main reasons:
- Important cheapening of computer equipment.
- The importance of geography in our everyday world, many of the decisions we make daily are related to geography.
Imagine that a car company wants to place its stand within the city according to the characteristics of the population. Population rent, age, existing car brand, etc. combine the location of your residential areas to find the right place. The
development of GIS began in the 1960s, but until the 1980s it has only been applied to the field of research. It has not been used as a decision-making tool.
The development of appropriate computer technology has driven the marketing of GIS products. This has been applied mainly to information generating organizations such as the Public Administration. The availability of GIS information in Windows environment since 1990 has made it easier for the application to reach private companies.
Advantages of digital mapping
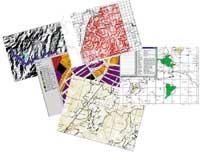
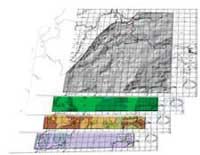
It can be said that digital mapping is composed of a set of maps. Each of them will present a characteristic: one in relief, another in hydrography, others in roads, etc. Each
loose thematic map corresponds to a layer or level. Overlapping layers, each of the sites has been assimilated to the corresponding ones in other maps. The lower layer is the most important: it describes the network of the reference system to be placed (longitude and latitude). All maps have been recorded according to the following.
Once registered, the information that appears in the different layers can be compared and analyzed by combinations. You can know, for example, where the power lines go through. In addition, selected sites or regions can be easily separated from other locations, cutting all layers around the desired location.
In all studies it is not necessary to use all maps or layers at once. In some cases the researcher will select the information to analyze the relationship between certain layers. In addition, the information of two or more layers can be combined and grouped into a single layer. With this we have achieved what will then be a layer.
Think that we have dozens or hundreds of maps or layers that explain information on different topics: transport networks, hydrography, population characteristics, economic activities, etc. and that we can combine them as we should. This
system would be useful in many situations: urban planning, emergency plans, etc. This ability to distribute layered information and its subsequent combination with other layers is the feature that GIS makes so useful. However, flexibility does not remain, as common databases and mapping databases can be combined.
GIS can answer different types of questions
The use and transformation of accumulated information allows a wide variety of operations:
Location
Identify what is in a particular location. The location can be described in several ways, for example by toponym, zip code or geographical references such as longitude and latitude.
Condition
Reverse to the previous one and requires spatial study. Instead of identifying what is at a point, you can find a place that meets certain conditions (for example, a plot without forests, with more than 2,000 m 2, about 100 m from the road, etc.)
Trend
Combine the above two questions. The answer explains the changes a place undergoes over time.
Distribution
This question is more complex. For example, if you wanted to determine whether cancer is a major cause of death among nuclear power plants. Its objective is to measure the strength or influence of different factors.
Modeling
This question arises when you want to know the impact of an action on a system. For example, what happens to the road network if we build a road, or what if a toxic spill occurs to the drinking water supply network? The system, in addition to the geographic information then, requires additional data as specific scientific laws.
GIS are suitable for urban use
Urban designers, changing the way cities are built, work to improve people's lives. For this, they must understand very well each of the places they study. In previous centuries the cities or towns were quite small and the designer could know well the needs of the inhabitants of the city, but the current cities are too large to work with this method of informal work.
There are many factors that influence the lifestyle of the city and the designer has to analyze many things to come to understand the place: aerial photos, construction plans, register data, economic studies, transport systems, etc. By not being able to have all this data at once in our mind, we currently use the planning system.
As the problem of urban design is data collection, analysis and explanation of spatial data, GIS has much to offer in this area. Although for years other sciences have used these systems, most urban designers, so far, have been immersed in a way of working semi-science, maintaining traditional instruments.
In the search for the solution a series of consecutive sketches of different aspects of urban life have been made, but the realization of them requires a lot of time, since the place of study must be studied and known with great precision: physical infrastructure, criminality, demography, etc. Most cities have not sent enough money or time to designers to analyze all these factors face-to-face. In this work of knowledge of the city, the GIS offer a great help, without having to analyze every m 2 of the city. In design, these largely intuitive methods have been replaced by analytical methods since 1960.
At that time, many people realized that U.S. urbanization was growing exponentially, and their institutions were not properly equipped to deal with this fact. As society became increasingly complex, the ability of a single person to understand a set of problems on a given subject was being reduced. The planning process did not yet fit this situation. Many of the planning tasks in other areas began to use computerized data as an aid, but this trend did not develop in the design of the city.
How are these systems?
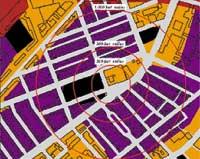
To create a significant urban core it is necessary to know the state of the buildings, streets, walks, railways, topography, etc. For a city to be understandable, its neighbors must also know certain elements. These elements are knots, road networks, districts and significant places of the city. The knots are formed by transport links and activity concentrations. Road networks, people (on foot, by car, etc.) are the channels you use to travel. Districts are urban parts with the same characteristics. The significant aspects of the city are used as a reference. To define and correct the ongoing representation of the city, the designer must be able to plot knots, roads, districts, etc. to discover it, as it finds the inhabitants of the city. GIS can help a lot in the search for knots, etc.
Data sources currently available on an aspect of the city can be used for conducting studies of interest to the designer city. For this it is necessary to have a system of information capable of making explanations when collecting information, synthesizing the collected and translating the results. To accomplish this task, GIS has unbeatable characteristics.
The advantages of this system are:
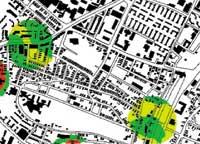
- Designers can analyze most of the landscape. In fact, once the data is entered in the GIS, the computer system allows a sufficiently fast processing of all the information contained in the database. This advantage is clearly seen in the search for urban knots: GIS finds activity concentrations in part of the city.
- Having a computerized system will lead us to new types of analysis and working methods.
Urban use GIS must have special characteristics
New interface for space studies will be needed to attract a group of workers to the world of GIS. Many times their thinking is not linear and their urban plans are not as structured as GIS technology requires.
Although they are not yet fully adapted to the use of urban planners, GIS play an important role in urban design and planning. To create a specific information system for designers, three questions must be taken into account: the possibility of obtaining data, the user interface and the possibility of handling objects representing urban elements.
Telecommunications, text processors, databases, spreadsheets and GIS software must work together to maximize the performance of the work being done.
In the future what?
Many disciplines can benefit from GIS techniques. The continuous improvement and cheapening of GIS hardware and software has allowed the creation of a live market. This
development leads us to a wider application of technology, both at the government and business and industry level.
Maps have traditionally been used to study the Earth and exploit its resources. GIS technology, as an extension of cartographic science, has improved the effectiveness and analytical capacity of traditional mapping. Now that science is aware of the environmental consequences of human activities, GIS technology is becoming a necessary tool to understand the process of global change.
Different maps and satellite information can be combined to simulate complex interactions in nature. In addition to the rendering function, GIS can be used to create images, not only maps, but also drawings, animations and other cartographic products. Thanks to these images, researchers can see their subjects in more detail than ever. These images also help non-scientists express technical concepts.
It allows analyzing the surface, atmosphere or state of the interior of the Earth by entering the data collected by the satellite in a GIS. GIS technology allows researchers to analyze Earth changes in days, months, and years.
Adaptations are being generated in each of the areas, improving the availability of these systems, such as urban planning, environmental research, urban municipal services, etc.
They have already begun to make available to the public the material of GIS systems through the Internet. In this way, this communication system that advances without stopping in recent times, allows to improve collaboration and results.
Process of creation and exploitation of GIS
|
- In what areas can GIS be applied?
- Is it interesting to collaborate in the works of urbanization?
- Is this system capable of increasing human design capacity?
To make a systematic design, 5 steps must be followed:
- You have to decide what are the most important things to understand the city.
- To identify these important things it is necessary to create algorithms.
- The user interface must have a balance between simplicity and flexibility.
- An urban design module must be flexible in defining algorithms. This module should allow the user to create their own analysis tool.
- A GIS planning should include methods for collecting citizenship data and for the organization and graphic synthesis of this information.
Zu idazle
Zientzia aldizkaria