

Develop an interactive European map of local temperature changes
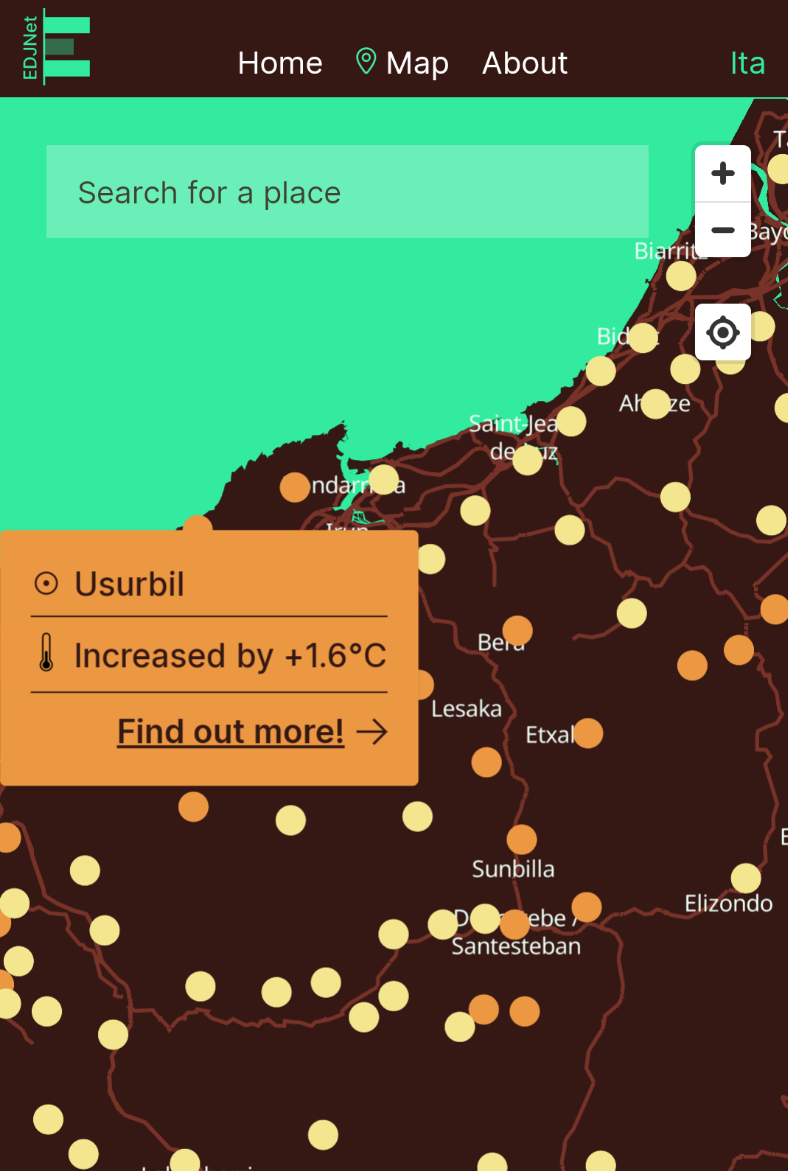
They have developed an interactive European map showing the place by the temperature change experienced in the last fifty years. This is exhaustive data, since more than 100,000 municipalities have taken into consideration and, in view of the evolution of temperatures, claim that the entire continent is heating up. In fact, in a third of these municipalities, the average temperature has risen more than 2 ° C from the 1960s to the last decade, with differences in some areas up to 5 ° C. The exceptions are almost negligible: Of the 102,445 zones, 73 show a decrease in average temperatures, but only a few tenths of a degree.
The study was conducted by OBC Transeuropa in 2020 for the European Data Journalism Network (EDJN). It is based on data collected by Copernicus and the ECMWF centre between 1961 and 2018. Specifically, the data provide temperature values measured at two meters from the ground and cover a grid of zones of 5.5x5.5 km of sand. In areas without population, the data are not real, but estimated by approximation.
The map can be seen in https://climatechange.europeandatajournalism.eu/en/map
Zu idazle
Zientzia aldizkaria