
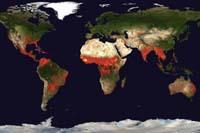
Satellite mapping of forest fires
Kartografia eta Geodesia ingeniaria eta Topografia Ingeniaritza Teknikoko irakaslea
EHU
Kartografia eta Geodesia ingeniaria eta Topografia Ingeniaritza Teknikoko irakaslea
EHU
recovery process.
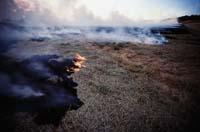
Fires and their effects
Forest fires, bush or bush fires and burning agriculture have a great influence on the environment, from the lowest to the highest scale. Intentional deforestation completely alters local landscapes. At the regional level, fires affect the structure and composition of vegetation in the ecosystems of natural phenomena, such as boreal forests and the Mediterranean chaparral, as well as the biogeochemical cycle and hydrology. Forest fires also have a major influence on climate change by generating gases and particles (aerosols) that contribute to the greenhouse effect.
Each ecosystem responds to fire in a different way, so depending on the ecosystem, the fire can have different consequences. Therefore, in addition to knowing the location and extent of the fires, it is essential to know the characteristics of the burned areas.
However, although fires have a large incidence worldwide, they generate greater attention at a smaller scale (regional or local). Mediterranean fires are an example of this: it takes into account how they affect the economy and the environment of the region, but the global effects are not analyzed.
Remote sensing sensors
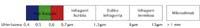
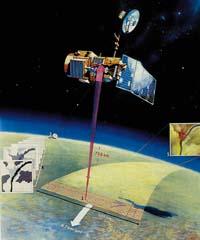
Working with satellite images has great advantages. First, it allows us to investigate phenomena with a global vision, since images of almost everyone are obtained systematically and in similar situations of observation. On the other hand, the diversity of sensors allows satellites to perform multi-scale and targeted work. In addition, our eyes receive information from other areas of the electromagnetic spectrum that they do not perceive. Thus, many phenomena look better, like burned areas.
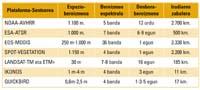
Sensors can also be classified according to the resolution. There are three types of resolution: spatial, spectral and temporal resolution. Spatial resolution is defined as the measurement of the smallest element of the image, i.e. the size of the pixel. The highest spatial resolution is about one meter and the lowest of a few kilometers. Spectral resolution is defined as the number of sensitive spectral zones, i.e. the number of bands. Currently there are very high spectral resolution sensors (they can contain hundreds of bands) called hyperspectral. Finally, the temporal resolution may vary from a few minutes to a month, indicating how often the image of the same rural space is taken.
These three resolutions are in some balance. High temporal resolution sensors usually have low spatial and spectral resolution, and are commonly used in meteorology. On the contrary, people with high spatial resolution present a low temporal and spectral resolution.
Fire and sensors
Two decades ago satellite estimates of the burned surface were started by detecting active fires. This detection is based on the high levels of radiation produced by the temperature of the fires (band of about 3.6 mm). But it was not very useful, as the satellite passed too often to know the exact development of the fire. In addition, smoke and fog caused by the fire in many cases prevent fire detection.
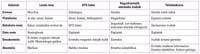
Therefore, sensors and bands should be selected by zones for satisfactory results. For example, for the detection of active fires, high temporary resolution sensors such as NOAA-AVHRR, ESA-ATSR and, since 2000, EOS-MODIS have been used. The latter sensor provides high-quality data, images are georeferenced and the effects of the atmosphere and mists are corrected and calibrated. Based on these images, they have developed a standard product worldwide: MODIS MOD14 Fire and Thermal Product Anomalies. Binds the active fires detected daily in a spatial resolution of one kilometer.
However, because active fire detections are not adequate to measure burned areas, other techniques have been developed. These techniques are based on the detection of changes caused by fires, such as the deposition of ash and coal, the disappearance or alteration of vegetation.
At the regional level, in addition to the aforementioned NOAA-AVHRR and EOS-MODIS sensors, considerable work has been done with other medium spatial resolution sensors such as SPOT-VEGETATION. In addition, at this level, and also at the local level, it is very common to use images of the Landsat-TM and Landsat ETM+ satellites. In addition to having good spatial resolution, they have adequate spectral resolution (visible spectrum, near infrared, medium infrared and thermal band) and are very effective for mapping burned areas. Most national cartographic systems in burned areas are based on these images.
What to measure?
Before performing any type of mapping with remote sensing it is essential to know how the elements that want to be reflected on the map behave in the different areas of the spectrum. This is known as spectral signature and, once known, objects can be detected from images.
The spectral characteristic of burned areas is related to the time elapsed since the fire, damage caused and previous vegetation, explaining the short-term and long-term effects.
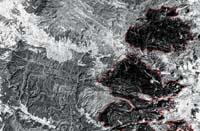
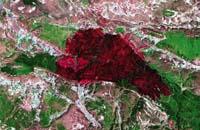
Short-term spectral change is a consequence of the combustion of vegetation, the deposition of ash and coal, and produces a significant color change in the visible spectrum (green to black or brown). Although this change does not last too long in the Mediterranean, in boreal forests it can last for years. The change is even greater in other spectra, as for example in the near infrared reflectivity decreases considerably, especially in areas with high fuel content, due to the high generation of coal.
In short-wave infrared, reflectance tends to increase due to water loss from plant tissues. For many researchers, this band is very suitable for mapping burned areas, since the influence of atmospheric dispersion is less than in others. As for the thermal bands, you can see a slight increase in temperature that disappears immediately after the fire.
The long-term condition is much more stable, as it is based on the change that the vegetation structure suffers. But change may be due to other factors such as grazing, wind, water stress, phenology, or insects. It is therefore very difficult to capture the long-term impact on the map.
Methodologies for mapping creation
Digital analysis is a much faster methodology, but it can give more problems, although in some cases it is more accurate than visual analysis. One of the biggest advantages of digital methodologies is automation, since if well-controlled algorithms are designed, only the computer can map. Unfortunately, algorithms do not work well in all cases and require some visual guarantee.
For digital analysis, new data is often created from basic data. This is the case, for example, of burned zone indices. These indices are based on the operations of the origin bands and serve to better differentiate the burned areas from other areas.
Digital analytics can be processed in two ways. Those that use images with high temporal resolution are based on the technique called change capture. In this technique, an analysis of each pixel is performed over time to assess whether there has been any change in fire behavior. In the simplest way, the analysis is done by comparing the start and end images of the fire. Pixels that have changed a lot tend to have high values in these burned indexes and are collected on the map that are burned, provided they have spectral characteristics of burned areas.
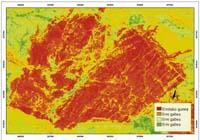
Otherwise, when working with less temporary resolution images (and therefore with higher spatial resolution), post-fire images are normally used. Since they are not comparable to the above values, they are only based on the spectral characteristics of the pixels. It can be done by different methods, being one of the simplest the method of assignment. In this case, depending on the index of burned zones, the map collects all pixels that exceed a value.
Research lines
In recent years they have been investigated in three areas. On the one hand, in the development of new indexes, to improve the difference between burned zones and surfaces with similar spectral results. On the other hand, numerous research is being carried out in the evaluation of the degree of condition. Finally, we are studying the application of the cartography of the burned area at regional and global level, based on the new sensors launched in recent years.
We want to thank the Department of Geography of the University of Alcalá and especially Professor Emilio Chuvieco for the images given.
Zu idazle
Zientzia aldizkaria